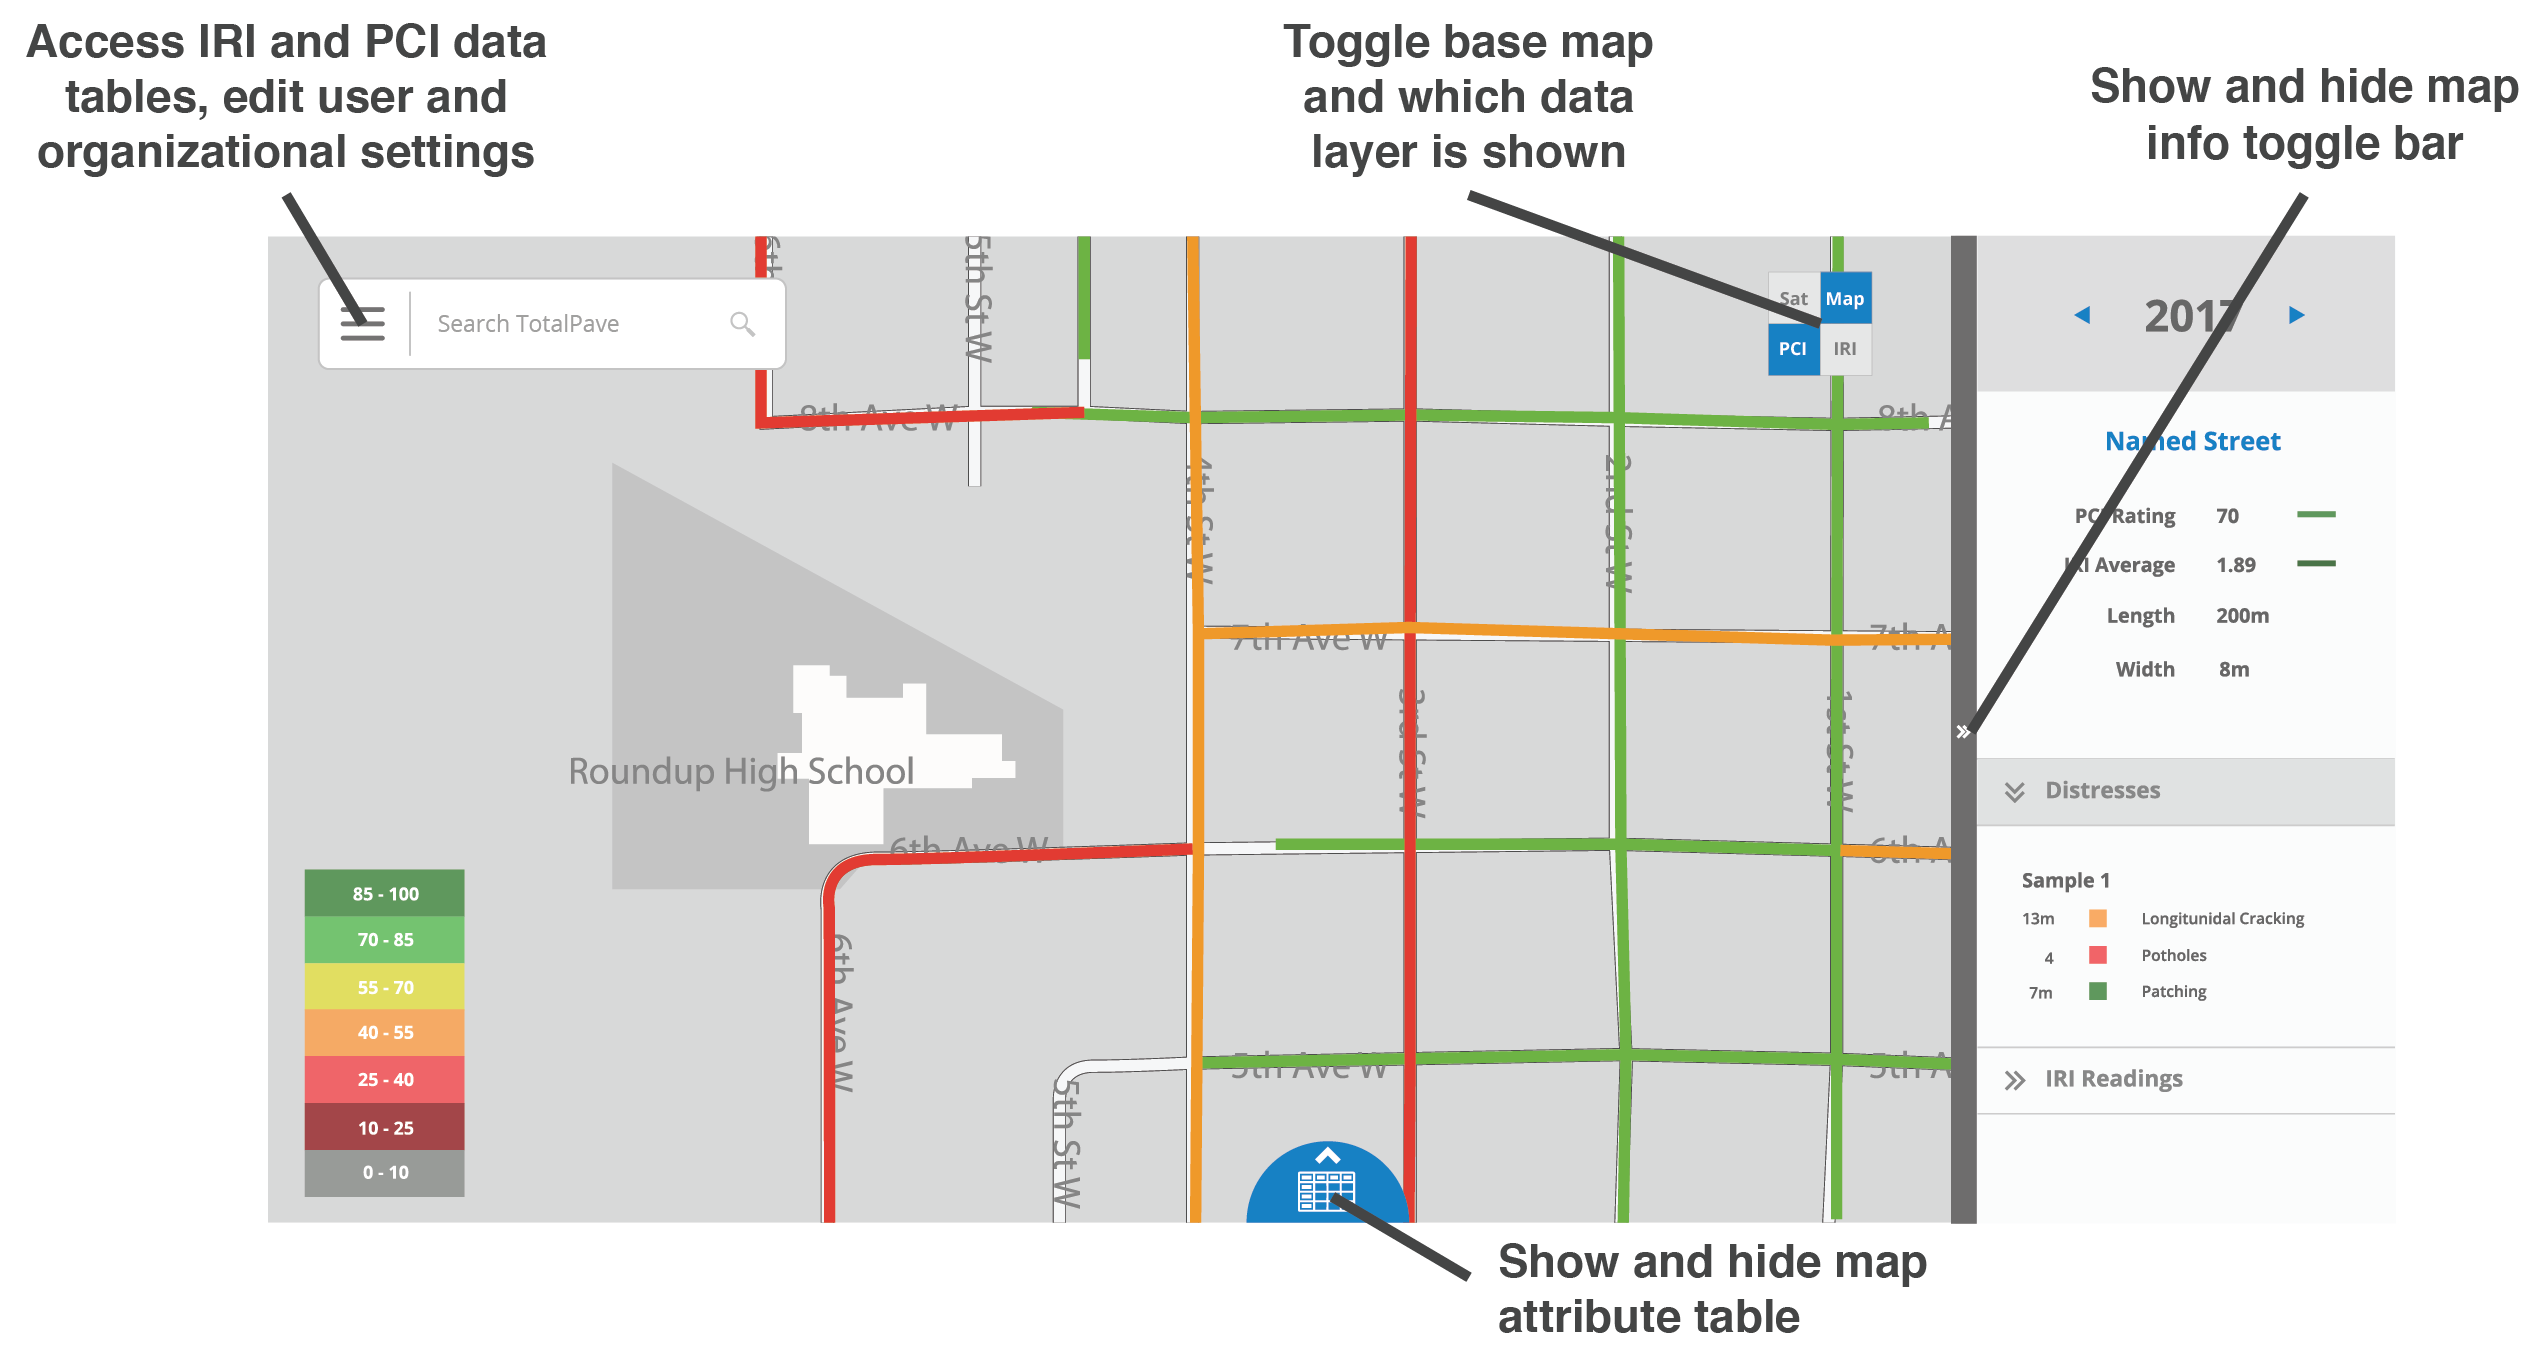
The map dashboard displays the PCI, IRI, and Tracker data collected in the field on a handy color-coded map. Here are some handy features to get you started with the dashboard:
- Clicking on a section from the map reveals survey information on the righthand info bar
- Double clicking a section in the map dashboard snaps you to the section in the attribute table, and vice versa
- See data from previous years using the year toggle at the top right of the info bar